Journal of Animal Research: v.10 n.1, p. 67-75. February 2020
DOI: 10.30954/2277-940X.01.2020.9
Assessment of Livestock Production Technologies and Package of Practices through Multivariate Typology: A Case of Maharashtra, India
ABSTRACT
The study was carried out in four different agro-climatic zones of Maharashtra. A typology was developed applying multivariate statistical techniques i.e. Cluster analysis (CA) to classify groups of farm households with similar farm characteristics into four homogenous clusters, (i) households possessing small landholding, a larger high yielding dairy stock with small goat flock size (37.5%), (ii) households having small landholding with a small stock of high yielding dairy animal and small goat flock size (39%), (iii) households having large landholding with large high yielding dairy stock and small flock size (13.5%) and (iv) households possessing small landholding with small high yielding dairy stock and large flock size (10%). An assessment in terms of awareness, knowledge and adoption of dairy technologies and goat production practices were carried out across the clusters which was found significantly high within the household of cluster 3 and 4. The overall adoption index was found to be 65.16 per cent across the whole clusters. Multiple regression analysis revealed that total SAU, flock size, occupation, innovative proneness, scientific orientation, awareness of technology and knowledge of technology contribute positively (P˂0.01, P˂0.05) to the adoption of technology. The coefficient of determination was found (R2 =0.66) across the whole clusters.
Keywords: Multivariate typology, Cluster analysis, Spearman’s Correlation, Multiple regression analysis, Adoption index, Maharashtra
Indian livestock sector (512.05 million) is one of the largest in the world (996.36 million) with a holding of 11.6 per cent of the world’s livestock population (Anonymous, 2017-18). The knowledge and technology adoption in the livestock sector is important for policymakers in connection with augmenting farmers’ income. A number of studies on awareness, knowledge of farmers and adoption of technologies have been carried out in different agro¬climatic zones of India (Meena et al., 2017; Gautam et al,2016; Tiwari et al, 2013; Prajapati et al, 2012). However, scant research attention has been given on identifying typical farm households and examining how awareness, knowledge and technology adoption varies across these households. It is well recognized that knowledge and adoption of technologies vary across different livestock production systems categorized on the basis of relevant socio-economic and farm characteristics of households. Typology constitutes an essential step in any realistic evaluation of the opportunities and constraints exist within farm households and also targeting efforts and investment by policymakers (Bidogeza et al, 2008). In the above context, the present study was conducted with the objective of assessing awareness, knowledge and adoption of livestock production technologies and practices.
MATERIALS AND METHODS
Sampling and data
The study was carried out in four different agro-climatic zones of Maharashtra. Multistage purposive and stratified random sampling was followed in the selection of agro-climatic zones, districts, blocks, the cluster of villages and respondents for the study. Four agro-climatic zones (Scarcity zone, Assured rainfall zone, Moderate rainfall zone, and Eastern Vidarbha zone) of Maharashtra state were selected purposively having familiarity, accessibility and to provide better representation of livestock, highest and lowest productive zone, besides two other zones at equidistant places were selected. Further, two districts from each zone were selected purposively having 50 percent and more coverage area in a particular zone. From each of the districts, two blocks selected randomly and a cluster of two villages was selected purposively based on the population of livestock i.e. dairy and goat. Further, from the purposively selected cluster of two villages, 25 farmers were selected randomly with equal representation to livestock production system on the basis of possessing of minimum 2 adult animals (dairy and goat). Thus, a total of 400 farmers’ were included in the study from 8 districts.
How to cite this article: Pathade, S.S., Singh, B.P., Chander, M. and Bardhan, D. (2020). Assessment of livestock production technologies and package of practices through multivariate typology: a case of Maharashtra, India. J. Anim. Res., 10(1): 67-75.
The data were collected through personal interview method with the help of well structured, comprehensive and pre-tested interview schedule. Data were collected on parameters like awareness of farmers about different dairy production technologies and goat production practices on three-point continuum viz., not aware, partially and fully aware. Further, to assess the knowledge level about dairy production technologies and goat production practices knowledge test was developed. The final statements obtained in the knowledge test were given to the respondents in the study area on a two-point continuum of ‘Yes’ and ‘No’ having weighatage of 1 and 0, respectively. Further, adoption index for each farmer was computed by score obtained for individual divided by total obtainable score and expressed as a percentage. The farmers were categorizing into three categories (non-adopters, partial and full adopters) on the basis of their level of adoption measured in terms of adoption index for each cluster.
The data were coded, classified, tabulated and analyzed using software statistical package for the social science (SPSS 20). The presentation of data was done to give a pertinent, valid and reliable answer to the specific objective. Frequency, percentage, mean, standard error, one way ANOVA, Post Hoc Test (Tukey HSD), Spearman’s correlation and multiple regression analysis (OLS technique) were worked out for the meaningful interpretation.
Multivariate typology of farm households
A typology was used to classify groups of farm households with similar farm characteristics as presented in Table 1. Typology constitutes essential steps in the realization of any opportunities and constraints exist within the farm households. For this purpose typology described by Bidegeza et al. (2008) and Baral and Bardhan (2016) were used. Farm household typologies were constructed by using multivariate statistical techniques i.e. Cluster Analysis (CA). Table 1 represents the variables which were used to construct clusters. Cluster analysis seeks to typify entities according to their dissimilarity in terms of their attributes represented by the variables. Entities within a certain group (cluster) should be very similar to each other and entities belonging to different clusters should be very dissimilar (Baral and Bardhan, 2016). A hierarchical cluster analysis using wards method and Euclidean distance was carried out to classify the farm households using the variables represented in Table1.
Table 1: Variables considered for construction of cluster analysis

Where, SAU- Standard Animal Units.
The objective of the present investigation was to compare the awareness, knowledge and adoption of animal husbandry technologies and package of practices belong to typical clusters. Therefore it was very important to consider the effect of various species/breed of milch animals kept by farm households. For this purpose, Standard Animal Units (SAU) of the bovine stock was derived for each farm household as per specification is given by Patel et al. (1988). The standard animal unit was derived to standardize output of different farms with different species of dairy animals.
RESULTS AND DISCUSSION
Awareness of livestock production technologies
Awareness is the arousal of conscious about something, critical for adoption of any new technologies. The technologies were divided into the subcategories viz, artificial insemination (AI), vaccination, deworming, tick control, cultivation of green fodder, feeding of green fodder, feeding of concentrate, clean milk production, balanced diet, mineral mixture, urea molasses, etc. The awareness of technologies was assessed on the basis of percentage, mean and standard error, presented in Table 2. Overall across whole clusters, it was found that 53.8 per cent were partially aware of artificial insemination technologies and 61.5 per cent were fully aware of vaccination across the clusters. Similar findings were reported by Mathialagan and Senthilkumar (2012) in poultry. Further, It was found that majority of the farmers (91.7%) belonged to cluster 3 and having high awareness level about deworming technologies. Further, 52.70 per cent were fully aware about tick control across the whole clusters. Regarding, cultivation of green fodder, it was found that 38.87 per cent and 55.15 per cent of the farmers were partially and fully aware respectively, across the whole clusters.
About feeding practices, 73.95 per cent of the farmers across the whole clusters were fully aware about green feeding while, (62.57%) were fully aware about the feeding of concentrates. Further, only 21.5 per cent of the farmers were fully aware about clean milk production practices across the clusters. Similarly, only 24.3 per cent farmers were fully aware about balanced diet technology across the clusters. The awareness about mineral mixture, it was found that across the whole clusters 41.4 per cent of the farmers were fully aware. Similar findings were reported by Tiwari et al. (2013) that 52.65 per cent of farmers were aware about area specific mineral mixture. Further, across the whole clusters, only 4 per cent of the farmers were fully aware about urea molasses technology and regarding this Naik et al. (2003) found in their study conducted in Goa that only 15 per cent of farmers were aware about urea molasses technology.
Overall, the farmers belong to cluster 3 and cluster 4 had significantly high awareness level about livestock technologies than their respective counterparts of cluster 1 and 2. A significant value (F=43.10) at P˂0.01 level indicates that treatments produce different effects among each cluster and were not of the same order. All possible comparison among the cluster means was made (Table 5). It was found that mean was significant at the 0.05 level.
Table 2: Distribution of respondents according to awareness of livestock production technologies across different clusters (N=400)
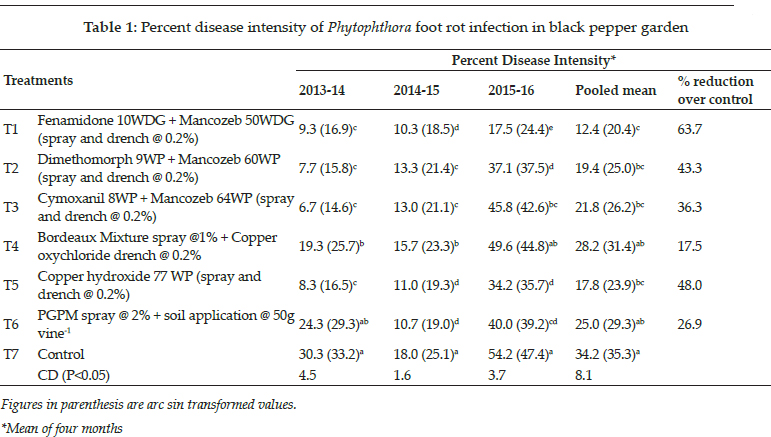
*Figures across different superscripts significant up to 0.05 level. *p˂0.05, **p˂0.01; Figures in parentheses indicate standard error.
Knowledge about technologies and package of practices with reference to dairy animals and goat production across the different clusters
The knowledge level of farmers about technologies and package of practices with reference to dairy animals and goat production was assessed on the basis of mean and standard error, which was further categorized into subcategories.
Livestock production technologies and package of practice for dairy animals
Livestock technologies and package of practices for dairy animals were categorized into AI, vaccination, feeding of green, feeding of concentrate, deworming, clean milk production, mineral mixture and chaff cutter. It was found that farmers belong to cluster 3 (0.85) and cluster 4 (0.70) were having a high knowledge level about artificial insemination. Further, farmers belong to cluster 4 (0.84) followed by cluster 3 (0.74) were having high knowledge about vaccination. Similar finding were reported by Kumar et al. (2016). Further, farmers belonged to cluster 3 had high knowledge level followed by cluster 4 about feeding green practices. Similarly, farmers belonged to cluster 4 (0.80) followed by cluster 3 (0.74) had high knowledge level about deworming. It was observed that farmers within cluster 3 and cluster 1 (possessing large herd size) were having a high knowledge level about clean milk production practices Prajapati et al. (2012) reported that only 9.33 per cent farmers had knowledge about clean milk production. Further, farmers within cluster 3 (0.74) followed by cluster 4 had high knowledge about the practices of feeding mineral mixture to dairy animals. It was found that overall knowledge levels about dairy production practices were high (6.42) within households of cluster 3 (Large dairy herd size) followed by cluster 4, 2 and 1.
Technologies and package of practices for goat production
Technologies and package of practices for goat production were categorized into breeding, vaccination, deworming, feeding and other scientific practices. It was found that farmers’ belong to cluster 4 were having high knowledge level (0.60) about breeding due to owning large flock size, Pattamarkha et al. (1997) found that 50 per cent farmers were aware about goat breeding practices. Further, the farmers within cluster 4 possessed high knowledge level (0.76) followed by cluster 3 about vaccination. The farmers within Cluster 4 (Owning large goat flock size) possessed significantly high knowledge level about goat production practices than their respective counterparts of Cluster 1, 3 and 2 respectively. There was a significant difference in means across the clusters which were not of the same order.
Overall knowledge about technologies and package of practices of dairy animals across the clusters
Data revealed that farmers within cluster 3 were having high knowledge (6.42) followed by the farmers of cluster 4, 2 and 1. A significant F=90.26 at (P<0.01) level indicate that in each cluster there was a difference in means and not of the same order for each cluster (Table 5). Gautam et al. (2016) found a total mean of 10.5 for scientific dairy practices.
Overall knowledge about technologies and package of practices of goat production
Data revealed that farmers within cluster 4 (own large goat flock size) possessed high knowledge followed by the farmers of cluster 1, 3 and 2 respectively. There was a significant difference at 0.05 levels between mean values across clusters which was presented in Table 5. The F=261.72 value significant at P˂0.01 level produces a significant difference in means across clusters which is not of the same order.
Adoption of livestock production technologies across different clusters
Livestock production technologies adopted were divided into subcategories (Table 4). It was found that 22, 24.5 and 53.5 per cent of the farmers were fully, partially and not adopting artificial insemination practices, respectively. Similar findings were reported by Letha Devi (2016) while Meena et al. (2017) reported that 80 per cent of farmers had fully adopted the artificial insemination. Further, 67.8 per cent had full adoption of the vaccination technology across the clusters. Deworming practices were adopted fully by 46.42 per cent of the respondents across the clusters. While, 51.5 per cent of the respondents had full adoption of tick control measures across the whole clusters. Further, pertaining to the cultivation of green technology, it was found that 56.5 per cent of the respondents had full across the whole clusters. About the adoption of green fodder feeding practices, it was found that 71.5 per cent of farmers had full adoption across the whole clusters. Letha Devi (2016) and Rezvanfar (2007) found that 92 per cent farmers had partial adoption of green fodder feeding.
Table 3: Distribution of respondents according to their knowledge about technologies and package of practices about the dairy animals and goat production
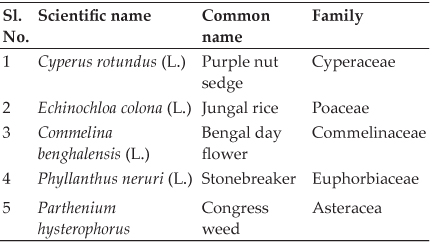
*Figures in parentheses indicate standard error; *Figures across different superscripts significant up to 0.05 level. **p˂0.01.
Table 4: Distribution of the respondents according to the adoption of livestock production technologies across different clusters
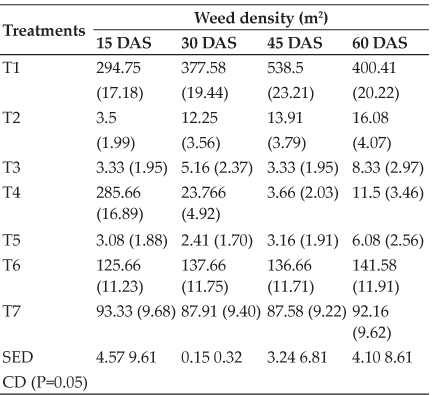
*Figures across different superscripts significant up to 0.05 level. *p˂0.05, **p˂0.01; Figures in parentheses indicate standard error
Regarding concentrate feeding it was found majority of farmers (62.5 %) had full adoption across whole clusters. Amuge and Osewe (2017) reported that 56.3 per cent of farmers adopted concentrate feeding. Further, as far as clean milk production is concerned it was found that only 18.3 per cent of the farmers had full adoption of technology across the whole clusters. Jeelani et al. (2015) found 25.40 adoption index of clean milk production. Regarding the mineral mixture technology it was found that 35.5 per cent of the farmers were full adopted across the clusters.
Adoption Index of livestock production technologies across the clusters
The adoption index was assessed and presented in Table 4. Data revealed that farmers belong to cluster 3 (possess large dairy herd size) were having high adoption index (80.30) followed by 78.4 for Cluster 2,65.48 and 56.19 per cent for Cluster 1 and 2, respectively. The overall adoption index was 65.15 which were contradictory with findings of Jeelani et al. (2015) who found 33.27 overall adoption index. There was a significant mean difference among clusters in adoption index which was presented in Table 5. The F=31.73 significant at P<0.01 level show a significant difference in means of adoption index which was not of the same order. Bhagat (2016) and Meena et al.(2012) reported that 50.44 per cent of farmers had adopted dairy husbandry practices.
Table 5: Post Hoc Tests (Tukey HSD)
*The mean difference is significant up to 0.05 level.
Spearman’s correlation coefficient between the adoption of technologies with selected variables across different cluster.
Table 6 revealed that education, farming experience, landholding, total Standard Animal Unit (SAU), income from dairy, total household income, scientific orientation; innovative proneness, awareness and knowledge of technologies had positive and significant (P<0.01, P<0.05) correlation with the adoption of technologies. These findings are in agreement with the findings of Prajapati et al. (2016), Sandeep et al. (2006) and Hasan et al. (2008). Credit linkage and occupation has a negative and significant correlation. It might be due to difficulty in availing credit facilities for the adoption of livestock production technology and variation in the occupation of farmers across the clusters.
Table 6: Spearman’s correlation coefficient between adoptions of technologies with selected variables

*p˂0.05, **p˂0.01.
Multiple regression of adoption of technologies with selected independent variables
Table 7 revealed that total SAU, flock size, innovative proneness, scientific orientation, awareness of technology and knowledge of technology contribute positively to the adoption of technology. These results are confirmatory with the findings of Musaba (2010). This implies that the above variables influence the adoption of technology among the farmers across the whole clusters. While occupation contributes negatively with the adoption of technology which might be due to variation in production systems across the clusters. The coefficient of determination (R2 =0.66) indicates 66 per cent variation in the overall adoption index of technologies. This is indifference with findings of Saidur Rehman (2007) who found 92 per cent variation in adoption index.
Table 7: Multiple regression of Adoption of technologies with selected independent variables

CONCLUSION
The study has concluded that the farmers belong to cluster 3 and 4 had high awareness, high knowledge level and high adoption of livestock production technologies than their respective counterparts. Therefore, awareness, knowledge and adoption of technology and package of practices should be promoted and targeted in other cluster households by using suitable extension interventions viz, use of ICT tools, mass media, training programs etc. The policy guidelines to design the suitable extension programs to cater the need of households of livestock farmers should be framed as per the category and types of the farm households.
Acknowledgements
I am thankful to the Director, Joint Director of ICAR- IVRI for providing me necessary facilities to carry out my PhD research work. I also appreciate the farmers and stakeholders in the study area for providing the data required to complete the research problem.
Conflict of Interest
No conflict of interest exist with any stakeholders involved in the research. The manuscript is the part of original PhD research work conducted in 2018-19.
REFERENCES
Amuge M.L. and Osewe D.O. 2017. Socio-economic factors influencing adoption of feed based dairy technologies among smallholder farmers in Ekerenyo sub-county, Kenya. AJAEES., 16 (2): 1-8.
Anonymous. 2017-18. Annual report. Department of Animal Husbandry, Dairying, and Fisheries, Ministry of Agriculture and Farmers Welfare, Government of India, New Delhi. Narayan, B.D. 2016. Relationship between socio-economic characteristics of the dairy farmers and the adoption of dairy husbandry practices in Ethiopia. Global J. Dairy Farming Milk Prod, 4 (6): 177-180.
Bidogeza, J.C., Berentsen, P., De Graaff, J. and Oude Lansink, A.G. 2008. Multivariate typology of farm households based on socio-economic characteristics explaining the adoption of new technology in Rwanda (No. 307-2016-4921, pp. 37-43). Devi, L. 2016. Adoption of dairy farming technologies by livestock farmers. Indian Res J. Ext.Edu., 13 (2): 57-61. Gautam, A. M. 2016. Measuring Farmers Knowledge Regarding Scientific Dairy Practices in Haryana. Indian Res. J. Ext. Edu., 15 (2): 114-118.
Hasan, C., Yavuz, C. and Murat, T. 2008. Socio-economic factors affecting the level of adoption of innovations in dairy cattle enterprises. Ankara Univ. Vet. Faculty., 55 : 183-187.
Jeelani, R., Khandi, S.A., Beig, M.Y., Kumar, P., and Bhadwal, M.S. 2015. Adoption of improved animal husbandry practices by Gujjars of Jammu and Kashmir. Indian J. Dairy Sci, 68 (3): 287-292.
Kumar, R., Singh, S.P., and Chauhan, S.V.S. 2016. Comparative analysis of knowledge of dairy farmers in the assured and less irrigated area regarding improved dairy husbandry practices. Indian Res. J. Ext. Edu., 9 (2): 85-88.
Mathialagan, P. and Senthilkumar, K. 2012. The extent of awareness and adoption of disease prevention and control by poultry farmers. Int. J. FoodAgril. Vet. Sci., 2 (2): 1- 4.
Meena, D.K., Ram, H. and Meena, B.S. 2012. Adoption of Improved Animal Husbandry Practices by the Members and Non-Members of Dairy Cooperative Societies in Bikaner. Indian J. Dairy Sci., 65 (4): 356-358.
Meena, N.C., Badodiya, S.K. and Biam, K.P. 2017. The extent of adoption of improved animal husbandry practices by dairy farmers of Morar Block in Gwalior District. Indian J. Ext. Edu, 53 (3): 90-93.
Musaba, E.C. 2010. Analysis of factors influencing the adoption of cattle management technologies by communal farmers in Northern Namibia. Livest. Res. Rural Development., 22 (6): 104.
Naik, P.K., Dhuri, R.B., Swain, B.K., Karunakaran, M., Chakurkar, E.B. and Singh, N.P. 2013. Analysis of existing dairy farming in Goa. Indian J. Anim. Sci., 8 (3): 299-303.
Pattamarakha, K., Tanapannarachwong, J. and Saithanoo, S. 1997. The use of recommended goat husbandry practices by farmers in southern Thailand. Asian-Austral. J. Anim. Sci., 10 (6): 587-592.
Prajapati, J.V., Bhatt, P.M. and Patel, J.B. 2012. Knowledge level of Tribal Dairy Farm Women about No-cost and Low- cost Technologies of Animal Husbandry. Gujarat J. Ext. Edu, 23 (4): 141-146.
Prajapati, J.V., Patel, J.B. and Bhatt, P.M. 2016. The extent of Adoption of Low-cost Technologies of Animal Husbandry by Tribal Dairy Farm women. Indian Res. J. Ext. Edu., 15 (4): 47-50.
Rahman, S. 2007. Adoption of improved technologies by the pig farmers of Aizawl district of Mizoram, India. Livest. Res. Rural Develop., 19 (1): 1-5.
Rezvanfar, A. 2007. Communication and socio-personal factors influencing the adoption of dairy farming technologies amongst livestock farmers. Livest. Res. Rural Develop.,19(3): 33-38.
Rupasi Tiwari, M.C. Sharma, and B.P. Singh. 2013. Awareness and impact of area-specific mineral mixture technology in a field situation. Indian J. Anim. Sci., 83 (4): 435-437.
Sandeep, J., Malik, S. and Singh, S.D. 2006. Comparative adoption level of farmers regarding improved animal husbandry practices in a watershed and non-watershed villages, J. Dairy Foods Home Sci., 25(1): 51-54.
Shibashish Baral and Bardhan, D. 2016. Multivariate typology of milk-producing households in Uttarakhand hills: Explaining profitability in dairy farming. Indian J. Agril. Econ., 71(2): 160-175.